How to use infographics in your next marketing campaign
Why should you consider using an infographic in your next marketing campaign
What do you think of when someone says, “marketing campaign”?
The photo of a smiling, diverse group of people under a cliché ad headline? Sure, we’ve seen that… a million times. And hey, the stock pic only cost $300!
Too boring.
The deep, meditative, film-like commercial with the superstar athlete or celebrity? We’ve seen that, too. But that cost $2 million.
Too costly.
Or the “user-generated content” campaign from that Fortune 100 behemoth? The one that backfired wildly when hackers manipulated the entries?
Too unpredictable.
Sure, marketing campaigns can come to life in many ways. None of the above are wrong, they’re just not right for everyone. But think for a moment about what type of online visuals have become beloved, engaging, highly shared artifacts over the last 10 years.
OK, you say memes. You’re not wrong! But good luck basing a marketing campaign on a meme format without looking like a loser.
No, we’re talking about infographics. That’s because infographics and visual storytelling have the ability to simplify complex messages and make abstract concepts concrete. Yet they can be just as fun and compelling as they are illuminating. People love good infographics. When the topic resonates with them, they dive in, learn, and share infographics more than any other kind of marketing ideas or content.
In fact, one study found that more than 40% of marketers said that original graphics (like infographics) performed best in marketing campaigns in comparison to all other types of visuals. Engaging content like that works to increase traffic and attention over time.
Why is this so? Infographics combine words, visuals, and data into easy-to-understand graphical presentations. They’re superb communicative tools when designed to be quick and easy to read. Studies also show that infographics help people learn information faster and retain that information longer than if they’d received it by other means.
Companies that use infographics and animated infographics can both clarify and diversify their marketing strategies, enlivening learning and boosting engagement for customers, prospective customers, and employees.
What’s the process for creating an infographic?
The best process for creating infographics is collaborative. Our approach works for companies large and small, helping them to achieve strategic communications, marketing, conversion, and revenue goals.
In the Discovery phase, a creative team connects with clients, subject matter experts, and other stakeholders to understand the campaign’s goal, identify audiences, and specify key content. The infographic may be “by the numbers”—highly data-based, or it may guide the viewer through an emotional or process-oriented story arc that resonates with the audience.
The Concept phase involves quick, iterative napkin sketches to flesh out ideas for the infographic design, and clear and impactful visual frameworks begin to emerge.
The Blueprint phase: Much like the blueprint of a house, everything is finalized here—including the content, flow, visuals, and branding—before real construction begins. The infographic is laid out to exact specs, copy is written, and visuals are sketched in detail.
The Production phase of the best infographics is all about bringing to life the preceding three phases, whether through design, illustration, animation or interactivity—or all of the above! It’s important work that ensures you’ve created a infographic with a long and useful life, something that stands out in your marketing channels as smart, high-quality, and trustworthy.
What are some examples of infographics effectively being used in marketing?
Tremendousness partnered with a company called Arivale to explain how the health and wellness startup uses a systems approach to help you optimize your wellness.
So what the heck does that actually mean?
Using the process outlined above, we created two marketing deliverables to make things crystal clear.
{% video_player “embed_player” overrideable=False, type=’scriptV4′, hide_playlist=True, viral_sharing=False, embed_button=False, width=’1920′, height=’1080′, player_id=’7759623101′, style=” %}
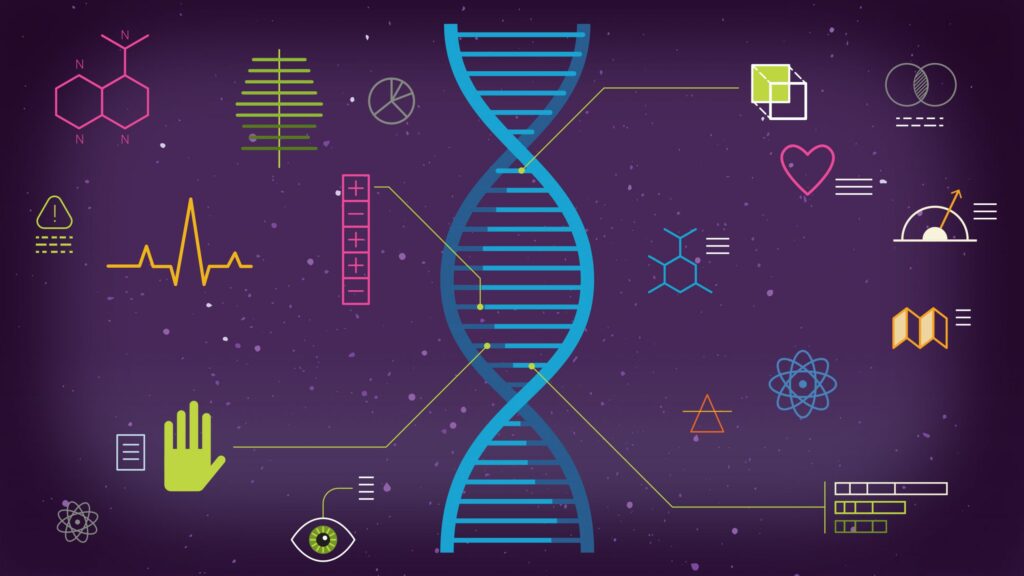
First, we worked with Arivale to streamline its story, developing it into a three-minute animated infographic movie. Easily shared, the video helps build awareness around this innovative and sophisticated health and wellness service and helps people understand what it is, why it matters, and how it works. The information-rich animation is friendly and engaging as it takes viewers on a tour through key steps in the Arivale customer journey—with an emphasis on what’s truly relevant to potential customers.
Specifically, the company looks at key aspects of your body and life—DNA, blood and saliva, gut microbiome, and lifestyle—and analyzes the millions of resulting data points to create a 360º view of you as an individual. This is complicated, highly scientific stuff. You’re then connected to an Arivale Coach who explains your unique data and provides you with clear, actionable recommendations based on your current situation and what you want to accomplish.
We also designed a web version of the experience so potential customers can walk themselves through the journey at their own pace.
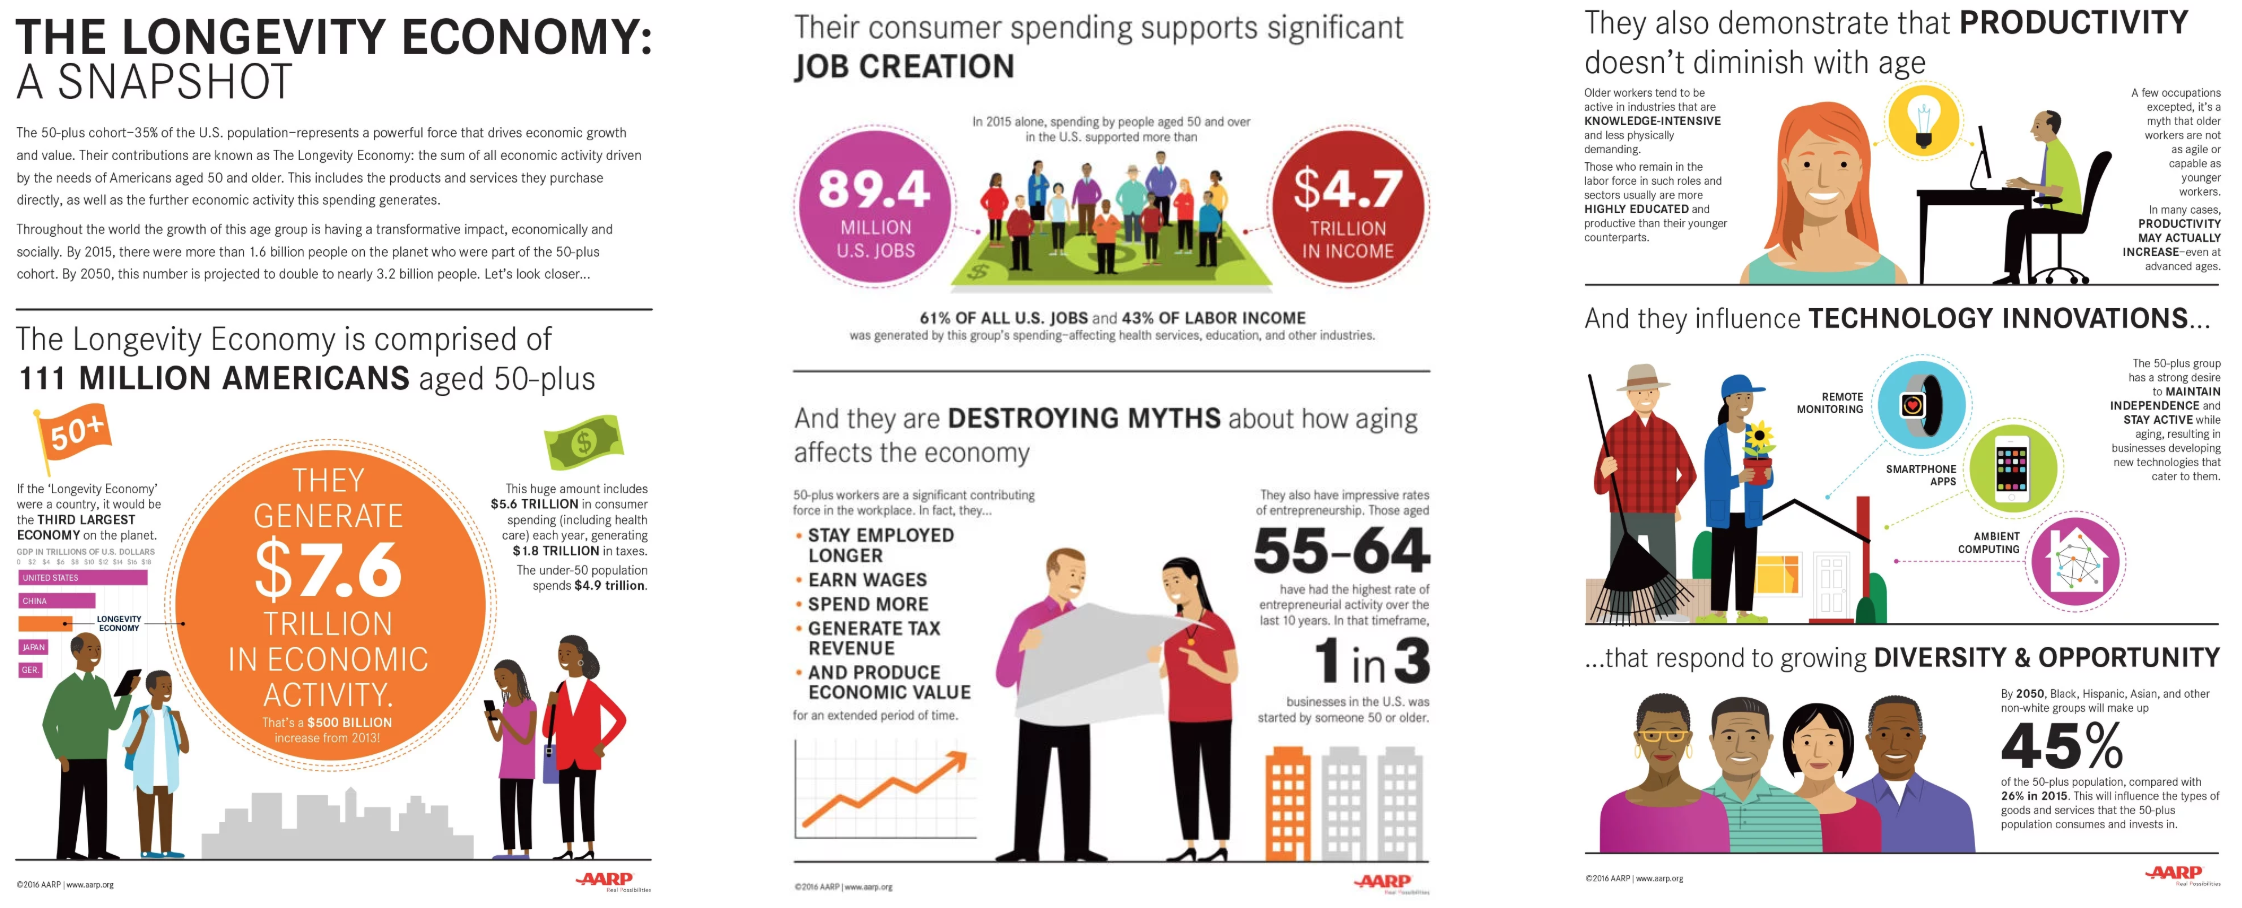
Another example of infographics being used as an effective communication tactic is this blog-format infographic created for AARP. AARP is the country’s leading non-profit for the 50+ demographic and advocates for positive social change by delivering value to members through information, guidance, and service.
Every few years, AARP publishes a Longevity Economy report highlighting the sum of all economic activity driven by the needs of Americans aged 50 or older. This infographic summarizes key findings from the report. It was formatted in two ways: long-form for online usage, which also included a design that broke the content into multiple sections that fit perfectly onto four letter-size pages for printing. Click here to view the long-form infographic.
How can Tremendousness help?
Tremendousness is a creative agency that uses visual thinking, information design and storytelling to help businesses, nonprofits, and other organizations explore and explain complex ideas, innovations, products, and processes.
In marketing campaigns, this may focus on the promotion of a new or improved product or service, the sharing of important insights or information, or simply increasing brand awareness.
Regardless, we collaborate with our customers—who range from startups to Fortune 500 firms—throughout the creative process, helping them discover, conceptualize, design, and produce impactful infographics. These can take a variety of forms, from static to animated, and from illustrated stories to data visualizations. Regardless, all communicate information in a clear and compelling manner—helping marketing campaigns stand out, and enabling companies to better serve customers, partners, and employees.
Team up with Tremendousness today to enjoy the many benefits of infographics, versatile tools that are well-equipped to help both large and small businesses market in a powerful, exciting way.